Sulfur Induction
| Portal |
|---|
|
Yeast Sulfur Project Portal |
| Home |
|
Sulfur Induction Homepage |
| Supplement |
|
supplementary figures and tables |
| Download |
|
raw and derived data used in the publication |
| Explore |
|
original expression data sets |
| Figures |
|
from the paper |
| Authors |
|
contacts who worked on the project |
| Figures | |
|---|---|
|
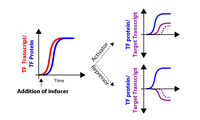
Figure 1: Schematic of TF induction experiments.
Prior to the addition of the inducer β-estradiol to the culture medium, PGAL1-TF alleles are not expressed. Upon inducer addition, TF transcript is rapidly made within 5 minutes (red). Upon being translated, the TF (blue) can act either as an activator or repressor in a direct (solid line, purple) or indirect (dashed line, purple) fashion. Prior to the addition of the inducer β-estradiol to the culture medium, PGAL1-TF alleles are not expressed. Upon inducer addition, TF transcript is rapidly made within 5 minutes (red). Upon being translated, the TF (blue) can act either as an activator or repressor in a direct (solid line, purple) or indirect (dashed line, purple) fashion. |
|
Figure 2: Gene expression analysis
Data from CBF1, MET31, MET32, MET28, MET4, and GEV-only (Control) induction experiments (triangles above the heatmap represent time in the individual experiments). Lowly expressed genes were first removed from the dataset, leaving 756 genes for analysis. We removed expression due to the GEV gene expression system by performing an SVD of the control (strain DBY12142) timecourse and projecting out the variation in the direction of the eigenarrays (i.e., the left eigenvectors of the SVD decomposition). Once the control signal was removed the data were hierarchically clustered. Particular expression clusters are numbered to the right and marked with colored stripes. The cluster marked with an asterisk contains mating genes: the strain used for Met31p induction is MATa, while all other strains are MATα. Promoters (-1 to -800 basepairs from the ATG) of genes in the 9 clusters were obtained from the RSAT database (Thomas-Chollier et al., 2008). The presence and variation of Met31p/Met32p and Cbf1p core motifs within these promoters was determined using the MEME algorithm. |
|
|
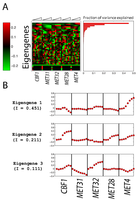
Figure 3: SVD of gene expression data.
Singular value decomposition (SVD) was applied to mean-centered gene expression data. (A) 40 eigengenes. (B) Information content of eigengenes. (C) The eigenexpression of the 3 most significant eigengenes. |
|
Figure 4: Cbf1p is an activator and a repressor.
Heatmaps of gene expression clusters 5 (A), 9 (B), and 3 (C). Below each heatmap is the mean expression trace for the cluster. The presence of the Met31p/Met32p core motif (black dot) or Cbf1 core motif (gray dot) in a particular gene’s promoter is denoted to the right. |
|
|
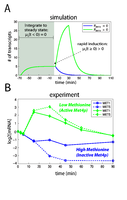
Figure 5: Simulations of parabolic transcriptional responses.
(A) Simulations of cofactor induction where there are either no activating proteins (PMET4 = 0) or a limiting number of activating proteins (PMET4 > 0). The plot shows the response of target gene transcript (MTARGET), whose dynamics are described by Equation 5, in response to induction of the cofactor. In the absence of activators, the cofactor (PCBF1) is by default a direct transcriptional repressor (blue line). In the presence of a limiting number of activators, gene expression is first stimulated before being repressed (green). (B) The experimentally determined transcriptional response of MET1 and MET5 in response to Cbf1p induction under methionine limitation (excess phosphate) or phosphate limitation (excess methionine). |
|
Figure 6: Met4p and Met32 exhibit feed-forward regulation.
(A, B) Heatmaps of gene expression clusters 7 (A) and 8 (B). (C) Expression levels prior to TF induction relative to Control (DBY12142) mRNA levels. (D) Expression of genes in clusters 7 and 8 in response to Met4p induction: MET4 (black line); MET32 (blue line); cluster 7 genes (green); cluster 8 genes (pink). (E) Network motif of genes in clusters 7 and 8. |
|
|
Figure 7: Interaction network of Met pathway regulators.
(A) Heatmap of the transcriptional responses of CBF1, MET31, MET32, MET28, MET4, and MET30 from induction data in Fig. 2. (B) Wiring diagram of interactions among factors. Stimulation of transcription is shown in red and repression is shown in green. Purple indicates post-translational feedback between either SCFMet30 and Met4p or Met4p-mediated recruitment of cofactor proteins to SCFMet30 as discussed in the text and in (Ouni et al., 2010). (C) Transcriptional responses of Met TFs in met6∆ cells starved for methionine in (Petti et al., 2012). |
|
|
Figure 8: Combined cluster of genome-wide expression data from induction and starvation experiments
Induction data from Fig. 2 and expression data from deletions (Petti et al., 2012) for the same genes were combined and then hierarchically clustered (left). Several clusters displaying functional enrichment are shown to the right along with the gene names. The most enriched processes in the different clusters based on Gene Ontology are (A) Iron Ion Homeostasis (p-value 7.36e-22), (B) Polyphosphate Metabolic Process (p-value 2.38e-08), (C) Carboxylic Acid Metabolic Process (p-value = 2.3e-04), (D) Sulfur Compound Metabolic Process (p-value = 2.12e-10), (E) Sulfur Amino Acid Metabolic Process (p-value = 7.37e-11), (F) Sulfate Assimilation (p-value = 8.65e-10), and (G) None. |
|
|
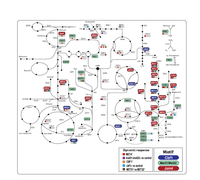
Figure 9: Systems-level regulation of metabolic genes by Met TFs.
The schematic represents an overview of yeast metabolism. Genes are first colored according to their promoter type. A promoter can contain a Cbf1p motif (blue), Met31p/Met32p motif (green), joint (red), or neither (no color). Motifs were mapped to promoters using the MAST algorithm. Second, genes that have expression changes in response to several different perturbations are marked with colored boxes. Significant responses to Met4p or Cbf1p induction are marked in red and orange respectively, while significant differences between met31∆met32∆/control or cbf1∆/control experiments are marked in purple and cyan, respectively. Finally, significant differences in expression in response to induction of Met31p and Met32p are marked in brown. Significance was determined using linear regression and template matching as described in the Methods. Genes repressed by Met4p are marked with an asterisk. While MET6 is a joint target, it is deleted in all strains (marked by †). Additionally, SUL1 and PDC6 are marked with † because MAST did not detect a Cbf1p binding site in the promoter of either gene. However, it was previously shown that the promoters of these genes each contain a non-canonical Cbf1p binding site (Cormier et al., 2010). |