Sulfur Induction
| Portal |
|---|
|
Yeast Sulfur Project Portal |
| Home |
|
Sulfur Induction Homepage |
| Supplement |
|
supplementary figures and tables |
| Download |
|
raw and derived data used in the publication |
| Explore |
|
original expression data sets |
| Figures |
|
from the paper |
| Authors |
|
contacts who worked on the project |
| Supplement | |
|---|---|
|
Figure S1 Gene expression data overview.
(A) Clustered heatmap of methionine-limited GEV experiments collected in this study. 872 genes were floored to a log2-transformed value of 0 in each array and removed prior to clustering the remaining 5384 genes. (B) The number of genes that are upregulated >2-fold (green), repressed >2-fold (red), and the sum of both (black) at each timepoint when GEV is induced in DBY12142 (Control). |
|
|
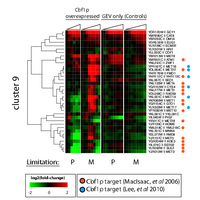
Figure S2: Cbf1p switches between a repressor and a co-activator of Cluster 9 genes based on choice of nutrient limitation.
Cells were grown under either 20 mg/L phosphate-limited (P) or 7.5 mg/L methionine-limited (M) growth. Cbf1p overexpression experiments are sampled out to 90 minutes. The phosphate-limited Cbf1p experiment samples are at t = 0, 5, 15, 30, 45, and 90 minutes following β-estradiol addition to the culture. The methionine-limited Cbf1p experiment samples are at t = 0, 2.5, 5, 15, 30, 45, 60, and 90 minutes. The GEV-only controls have an additional time-point at 2 hours. The phosphate-limited GEV-only experiment samples are at t = 0, 2.5, 5, 18, 30, 45, 60, 90 and 120 minutes. The methionine-limited GEV experiment samples are at t = 0, 2.5, 5, 15, 30, 45, 60, 90, and 120 minutes. Previously identified targets of Cbf1p are indicated in orange (p< 0.005; MacIsaac et al, 2006) and cyan (Lee et al, 2010). |
|
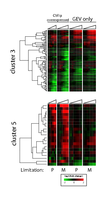
Figure S3: The transcriptional responses of Cluster 3 and Cluster 5 genes to Cbf1p induction under phosphate (P) or methionine (M) limitation. |
|
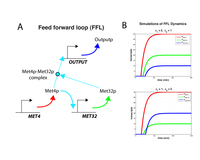
Figure S4: Simulations of feed-forward architecture.
(A) Met4p stimulates the production of MET32 transcript (and thus, Met32p protein). Met4p then forms a complex with Met32p and stimulates the production of a target gene (marked OUTPUT). (B) Numerical modeling of schematic in (A). The model can be found in Equations 1-6 in the Supplement. The parameters φ1 and φ2 are the strength of stimulation of MET32 transcription by Met4p and the strength of stimulation of OUTPUT transcription by the Met4p-Met32p complex, respectively. |
|
Figure S5: Heatmap of clustered transcription factor activities calculated with MatrixREDUCE.
The activities are shown for t = 2.5, 5, 15, 30, 45, 60, and 90 minutes following β-estradiol pulse from the time-zero transformed data in Fig 2. |
|

|
Figure S6: Comparison of expression data with biochemically-determined TF targets.
(A) The fraction of biochemically-determined (YEASTRACT) direct targets induced or repressed at least 2-fold in response by a TF. (B) The number of targets activated (A), repressed (R), or both activated and repressed (B) at least two-fold by a single TF. |
|
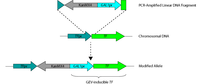
Figure S7: Construction of GEV-inducible alleles.
Linear fragments of KanMX4-PGAL1 DNA were PCR amplified with homology to genomic targets. Homology is chosen to place the new promoter and drug cassette between the first ATG of the TF open reading frame and the TF’s native promoter. |
|
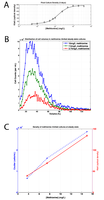
Figure S8: Growth of met6∆ strain with different levels of methionine.
(A) Final optical density (measured in Klett units) of methionine auxotroph strain grown in YNB + varying amounts of methionine for 2 days. (B) Histograms of cell volumes of cells grown in steady state (chemostat) cultures with 3.75, 7.5, or 15 mg/L of methionine. (C) Density of steady-state cultures determined by Klett and Coulter Counter. |