Sulfur Starvation
| Portal |
|---|
|
Yeast Sulfur Project Portal |
| Home |
|
Sulfur Starvation Homepage |
| Supplement |
|
supplementary figures and tables |
| Download |
|
raw and derived data used in the publication |
| Figures |
|
from the paper |
| Authors |
|
contacts who worked on the project |
| Figures | |
|---|---|
|
Figure 1. Overview of the background and the computational methods.
A) The transcriptional circuit governing sulfur assimilation and methionine biosynthesis. B) Overview of the preliminary bioinformatic analysis using met6Δ expression data to identify TFBMs for Met31p/Met32p and Cbf1p, and to distinguish the functional roles of these TFs using a web-based tool called Gene Ontology Term Finder (GOTF). C) Overview of the use of "TF dependency analysis" to compare TF deletion mutants in order to identify and characterize genes that depend specifically on Met31p/Met32p, Cbf1p, or both. D) Overview of the use of multiple regression and Student’s t-test to identify differences between MET31 and MET32. |
|
|
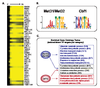
Figure 2. Functional specificity of promoter motifs derived from methionine-responsive genes.
A) Expression levels of genes that are induced early during Met starvation of met6Δ. B) DNA sequence motifs derived from the promoters of the genes in part A. C) Gene Ontology (GO) term enrichment of genes containing the Cbf1p motif only, the Met31p/Met32p motif only, or both motifs. |
|
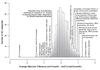
Figure 3. Transcription factor specificity among biological
processes.
Histogram of Gene Ontology biological processes, showing the average maximum expression difference between cbf1Δmet6Δ and met31Δmet32Δmet6Δ for each GO category with at least ten members. |
|
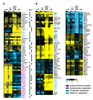
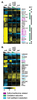
Figure 4. Genes whose expression depends on MET31/MET32.
A) Genes that depend statistically significantly on MET31/MET32 (but not CBF1) and contain a TFBM for Cbf1p (gray dot under column "C") and/or Met31p/Met32p (green dot under column "M"). Strain order for both panels is met6Δ, cbf1Δmet6Δ, met31Δmet32Δmet6Δ, met4Δ. The colored triangles are color-coded for each strain, and represent the decrease in methionine over each time course. B) Selected genes that depend statistically significantly on MET31/MET32 and lack a TFBM. |
|
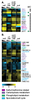
Figure 5. Genes whose expression depends on CBF1.
A) Genes that depend statistically significantly on CBF1 (but not MET31/MET32) and contain a TFBM for Cbf1p (gray dot under column "C") and/or Met31p/Met32p (green dot under column "M"). Strain order for both panels is met6Δ, cbf1Δmet6Δ, met31Δmet32Δmet6Δ, met4Δ. B) Selected genes that depend statistically significantly on CBF1 and lack a TFBM. |
|
Figure 6. Genes whose expression depends on MET31/MET32 and CBF1.
A) Genes that depend statistically significantly on both CBF1 and MET31/MET32, and contain a TFBM for Cbf1p (gray dot under column "C") and/or Met31p/Met32p (green dot under column "M"). Strain order for both panels is met6Δ, cbf1Δmet6Δ, met31Δmet32Δmet6Δ, met4Δ. B) Selected genes that depend statistically significantly on CBF1 and MET31/MET32 and lack a TFBM. |
|
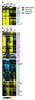
Figure 7. Genes that are regulated differently by Met31p and Met32p.
A) Select genes that differ significantly between met31Δmet6Δ and met32Δmet6Δ. Strain order is met6Δ, met31Δmet6Δ, met32Δmet6Δ, met4Δ. B) Select genes that differ significantly between cbf1Δmet31Δmet6Δ and cbf1Δmet32Δmet6Δ. Strain order is met6Δ, cbf1Δmet31Δmet6Δ, cbf1Δmet32Δmet6Δ, met4Δ. |
|
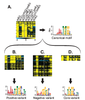
Figure 8. Met31p/Met32p motif variants.
. A) Expression levels of genes that are induced early during Met starvation of met6Δ, shown for all strains (left), and canonical Met31p/Met32p TFBM derived from the promoters of these genes (right). Strain order for all panels is met6Δ, met31Δmet32Δmet6Δ, met31Δmet6Δ, met32Δmet6Δ, cbf1Δmet31Δmet6Δ, cbf1Δmet32Δmet6Δ, met4Δ. B) Genes induced by Met31p/Met32p (top) and the "Positive" motif variant derived from their promoters (bottom). C) Genes repressed by Met31p/Met32p (top) and the "Negative" motif variant derived from their promoters (bottom). D) Genes that differ between met31Δmet6Δ and met32Δmet6Δ (top) and the "Core" motif variant derived from their promoters (bottom). |
|
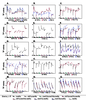
Figure 9. Transcription Factor Activities.
Calculated activity profiles for selected TFs across all strains. Each panel shows TF activity (vertical axis) for eight strains represented in the following order along the horizontal axis: met6Δ, cbf1Δmet6Δ, met31Δmet32Δmet6Δ, cbf1Δmet31Δmet6Δ, cbf1Δmet32Δmet6Δ, met31Δmet6Δ, met32Δmet6Δ, met4Δ. The colored triangles are color-coded for each strain, and represent the decrease in methionine over each time course. "TF activity" corresponds to the "t-score" in (Lee and Bussemaker, 2010), which is the regression coefficient obtained from regression of the expression data on the position-specific affinity matrix for the given TF (Methods). |
|
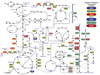
Figure 10. Overview of metabolic genes regulated by the Met TFs.
Key metabolic genes whose expression depends on Met31p/Met32p (green), Cbf1p (blue), or both (red) are highlighted in color. Putatively direct targets (which contain a TBFM and are expressed significantly differently from the met6Δ control) are surrounded by a black border, while indirect targets (no TFBM) are surrounded by a yellow border. |